

As discussed in my last post, after the recent fires and floods we should need no reminding of the path we are on to climate disaster. But the question we all want to answer is, what will the impact be for me and my family and friends? As I mentioned in that post it’s nigh on impossible to “forecast” the weather beyond the 3 – 10 day window. However it is possible to predict “climate”.
In this post, I’ll talk about the Irish case, but the raw data and general approach is likely to be applicable for all countries as the basic approach is based on work completed by the IPCC. Here in Ireland climate scientists have been developing climate models using the national supercomputer based in Waterford. The models divide the country into 4km square blocks allowing more detailed extrapolations than previously possible. The models are being used by various stakeholders allowing a much greater granularity of analysis in context with, for example flooding potential and energy demands. Significant conclusions have been drawn on widely varying subjects including wind speeds and wind turbine height, biodiversity impacts on inspect populations, farming practices etc.
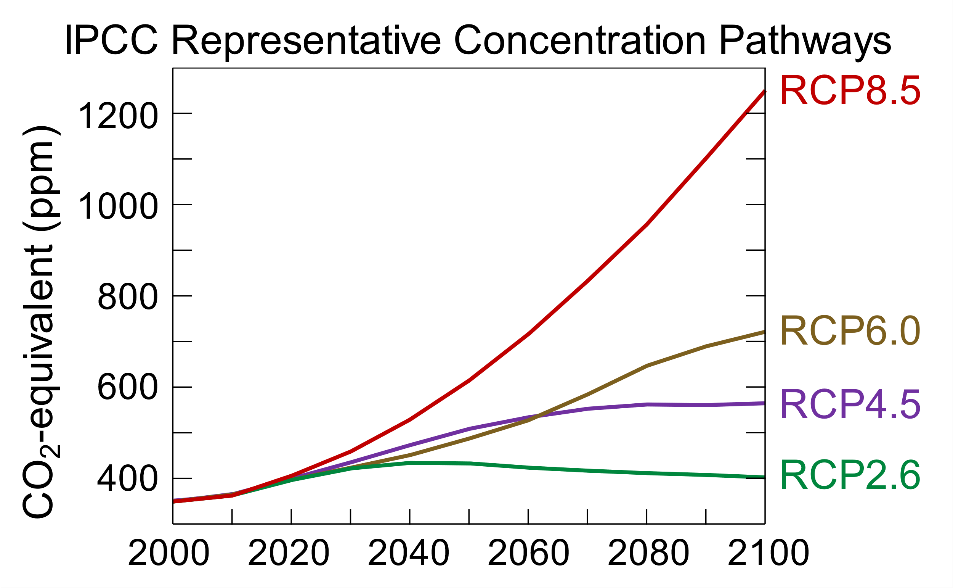
Clearly there are huge unknowns that will have major impact on the models (and reality), so the IPCC have defined a number of pathways spanning low impact up to worst case as shown below. The models allow us to analyse “plausible values”.
The Irish analysis chose just two pathways – intermediate (RCP4.5) and worst case (RCP8.5) for mid-century impacts. There are numerous conclusions, but I’ll just highlight a few, (see links below for more detail):
• temperatures are projected to increase by 1–1.6°C compared with the reference period (1981–2000), with an east-west gradient and with the largest increases in the east;
• the number of frost and ice days will decrease by approximately 50%;
• summer heatwave events are expected to occur more frequently;
• precipitation is expected to become more variable, with substantial projected increases in the occurrence of both dry periods and heavy precipitation events;
• mean 10-m wind speeds are projected to decrease for all seasons;
• an overall reduction of ~10% in the numbers of storms affecting Ireland, with an eastward extension of the more severe wind storms over Ireland and the UK;
• an increase in the length of the growing season of between 12% and 16%;
The first image below shows mean temperature change across three time periods, 2021-2050, 2041-2070 and 2071-2100. This shows the regional variation mid-century. As ever, temperature changes appear trivial, but we must remember that this is a foundational dataset, which allows us to extrapolate other variables. And in this context I am more interested in the second image below which examines precipitation.

The next image looks at precipitation by season for (a) the Intermediate (2050) RCP and (b) the worst case (2100). Immediately we see some really significant shifts in precipitation. Note the somewhat wetter winters, but in particular then much dryer spring, summer and autumn!

So what I did (below) was to take the 2041-2060 precipitation prediction and map this to our current Long Term Average for Cork Airport (my local weather station). Bear in mind these are “mean” numbers, and if you need reminding, take a look at my recent analysis of mean average deviations which reminds us that rainfall is increasingly volatile, and that as the atmosphere warms, the incidence of intense rain and hence flooding becomes increasingly probable. Note the overall shift in precip is not great. In both intermediate and worst cases the total precip mm is reducing, but not by a lot. However observe how the winters get wetter and the Spring to Autumn periods are significantly drier. We already have anecdotal evidence that climate change for Ireland will probably mean summer droughts. Here is further weight to that prediction.
| Long Term Average (LTA) | 2041- 2060 RCP4.5 (Mid case) % | Delta | Projection | 2041-2060 RCP8.5 (worst case)% | Delta | Projection | ||
| Winter | Jan | 131.3 | 3.5 | 4.6 | 135.9 | 11 | 14.4 | 145.7 |
| Winter | Feb | 97.8 | 3.5 | 3.4 | 101.2 | 11 | 10.8 | 108.6 |
| Spring | Mar | 97.6 | -5.2 | -5.1 | 92.5 | -6.7 | -6.5 | 91.1 |
| Spring | Apr | 76.5 | -5.2 | -4.0 | 72.5 | -6.7 | -5.1 | 71.4 |
| Spring | May | 82.3 | -5.2 | -4.3 | 78.0 | -6.7 | -5.5 | 76.8 |
| Summer | Jun | 80.9 | -11.1 | -9.0 | 71.9 | -17.2 | -13.9 | 67.0 |
| Summer | Jul | 78.8 | -11.1 | -8.7 | 70.1 | -17.2 | -13.6 | 65.2 |
| Summer | Aug | 96.8 | -11.1 | -10.7 | 86.1 | -17.2 | -16.6 | 80.2 |
| Autumn | Sep | 94.6 | -11 | -10.4 | 84.2 | -7.2 | -6.8 | 87.8 |
| Autumn | Oct | 138.2 | -11 | -15.2 | 123.0 | -7.2 | -10.0 | 128.2 |
| Autumn | Nov | 120 | -11 | -13.2 | 106.8 | -7.2 | -8.6 | 111.4 |
| Winter | Dec | 133.1 | 3.5 | 4.7 | 137.8 | 4.6 | 6.1 | 139.2 |
| Annual | 1228 | -67.9 | 1160.0 | -55.4 | 1172.5 |
This isn’t purely academic! From a practical point of view this will be helpful to me and my colleagues on the local allotments; we are looking seriously at rainwater harvesting, and this gives us hard data on which to understand what collection and storage capacity we need and crucially at what times of year.
I imagine many businesses and organizations will use this data to consider how they will respond. I hope many of my readers will consider doing similar analyses and consider the impacts for themselves. Do let me know I will be very interested to report on same.
Climate Change Becomes Real for Many
May The Circle Remain Unbroken
New Climate Projections 2020 – Met Éireann – The Irish Meteorological Service
Climate predictions for Ireland by 2050 come with unprecedented detail (irishtimes.com)
Nolan, P., O’Sullivan, J., & McGrath, R. (2017). Impacts of climate change on mid‐twenty‐first‐century rainfall in Ireland: a high‐resolution regional climate model ensemble approach. Int. Jour. of Clim.

With all due respect, the floods in Germany have not been caused by man-made global warming, they have occurred regularly and were predicted.
At least one town on the Mosel has learnt from past floods and built some defences:
https://www.lieser-mosel.de/en/the-flood-protection-dam/
They have experienced almost annual floods of lesser or greater depths but they stayed dry this year, despite a local rise in water levels of 7m (23 ft):
https://www.pegelonline.wsv.de/webservices/zeitreihe/visualisierung?ansicht=einzeln&pegelnummer=26500100
The Mosel river flow his month was probably about half of the maximums that have occurred in the last thousand years.
Hi Tim, Thanks for input. I note the scientists and the German Green party are rightly being very cautious about declaring any linkage. And, notwithstanding more than one month’s rainfall in 24 hours, any causal linkage is always going to be tenuous; that’s the nature of the beast. My point was that the images from Germany and NW America are a wakeup call regardless of explicit proof that will probably never be possible. And we should say the same about the situation in China, where the equivalent of a year’s average rainfall has fallen in just three days! But it these events should encourage us to look at how climate will change and understand potential impacts on specific localities. As you see from my work, the biggest issue looks like being summer droughts, and I and others are looking seriously at how we can mitigate that. Kind Regards, David
David, I believe there may well be more extreme weather in the near future, both droughts, deluged, heat waves and cold spells. However I don’t think they are due to changes in CO2, it’s entirely possible it will be due to changes in the solar behaviour, the jet stream and possibly the start of a new period similar to the Little Ice Age. In other words natural processes. At the moment these are being neglected as subject for study as all funds are driven by the CO2 focus. This worries me. BR, Tim