UK government’s set to approve new North Sea oilfield off coast of Shetland Islands
The Daily Mail, June 23rd 2021
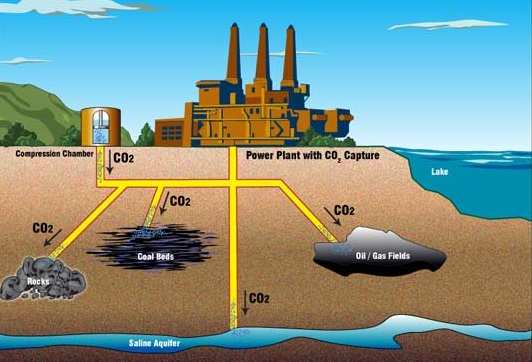
British Ministers are set to approve a new North Sea oilfield off the coast of the Shetland Islands months before Britain hosts a global climate change summit, reports say. Those behind the Cambo oilfield plan to extract 150 million barrels of oil under proposals handed to Downing Street by Siccar Point Energy, the Times reported. The oilfield, which will emit more than three million tonnes of carbon during its lifespan, could operate until 2050 – by which time Britain has vowed to be net carbon neutral. But the Cambo development will not be included in Boris Johnson‘s ‘climate compatibility checkpoint’, which will decide whether new projects are ‘compatible with the UK’s climate change objectives.’ Environmental activists have already called on the Government to block the proposal, which comes just months before the UN’s Cop26 climate conference in Glasgow.
UK Government leads by example in saving the world
The Guardian, 8th August 2021
Allegra Stratton is the UK Government’s No 10 press secretary, a highly influential person and a chief fixer at upcoming COP26. ‘I don’t fancy it just yet,” said Allegra Stratton, the No 10 press secretary turned prime minister’s climate spokesperson, when she was asked about getting an electric car. She preferred her old diesel, thank you.
Irish Government greenlights new agri-food strategy despite criticism
Irish Times, Aug 3rd 2021
A new strategy for Ireland’s food and drinks sector over the next decade, which sets a path for continued expansion while embracing sustainable production, has been approved by the Government. The Food Vision 2030 report, published on Tuesday, sets out a roadmap with exports rising from €14 billion to €21 billion by 2030, “further enhancing Ireland’s position as global leader in safe, sustainable agri-food exports”. It envisages Ireland becoming “a world leader in sustainable food systems over the next decade, delivering benefits for the sector, for Irish society and the environment”. It was developed by a cross-sectoral committee of 30 agri-food stakeholders.
Friends of the Earth director Oisín Coghlan said the strategy was “not aligned with our international obligations on climate pollution, biodiversity and water quality”.
Author’s note: In Ireland, agriculture represents 33 per cent of total emissions and is the single largest contributor to overall emissions. In the rest of Europe, agriculture represents on average 10 per cent of total emissions.
The Exodus of Expertise Under Trump
New York Times August 4th
Hundreds of scientists and policy analysts left the government during the last administration. That’s a problem for President Biden’s climate agenda. Former President Donald J. Trump’s contempt for climate science continues to reverberate, six months into the Biden administration. Mr. Trump’s political appointees undermined federal studies, fired scientists and drove many experts to quit or retire. Now, as a result, hundreds of jobs in climate and environmental science across the federal government remain vacant as President Biden attempts to push through ambitious climate action. Scientists and policy experts who quit have not returned. Recruitment is suffering, according to federal employees, because government science jobs are no longer viewed as insulated from politics. And money from Congress to replenish the ranks could be years away.
“The attacks on science have a much longer lifetime than just the lifetime of the Trump administration,” said John Holdren, a professor of environmental science and policy at Harvard.
Australian government to appeal ruling that it must protect children from climate harm
The Guardian 9th July 2021
The (Australian) environment minister, Sussan Ley, will appeal yesterday’s federal court declaration she has a duty of care to protect Australian children from climate harm that would be caused by the expansion of a coalmining project. Some of the eight schoolchildren that brought the case to the federal court have reacted with dismay to the appeal, with one saying the government was now fighting for the right to cause them harm. The historic judgment by Justice Mordecai Bromberg placed into law the minister’s responsibility after a case against the Vickery coalmine expansion was brought by the eight schoolchildren and a nun.
The children had tried to force an injunction, stopping Ley from approving the expansion plans for Whitehaven Coal’s project near Boggabri, New South Wales. The minister has still to make a decision on the plans.
Despite Pledges to Cut Emissions, China Goes on a Coal Spree
Yale Environment 360 March 24 2021
China is building large numbers of coal-fired power plants to drive its post-pandemic economy. The government has promised a CO2 emissions peak by 2030, but the new coal binge jeopardizes both China’s decarbonization plans and global efforts to tackle climate change.
Coal remains at the heart of China’s flourishing economy. In 2019, 58 percent of the country’s total energy consumption came from coal, which helps explain why China accounts for 28 percent of all global CO2 emissions. And China continues to build coal-fired power plants at a rate that outpaces the rest of the world combined. In 2020, China brought 38.4 gigawatts of new coal-fired power into operation, more than three times what was brought on line everywhere else.
A total of 247 gigawatts of coal power is now in planning or development, nearly six times Germany’s entire coal-fired capacity. China has also proposed additional new coal plants that, if built, would generate 73.5 gigawatts of power, more than five times the 13.9 gigawatts proposed in the rest of the world combined. Last year, Chinese provinces granted construction approval to 47 gigawatts of coal power projects, more than three times the capacity permitted in 2019.
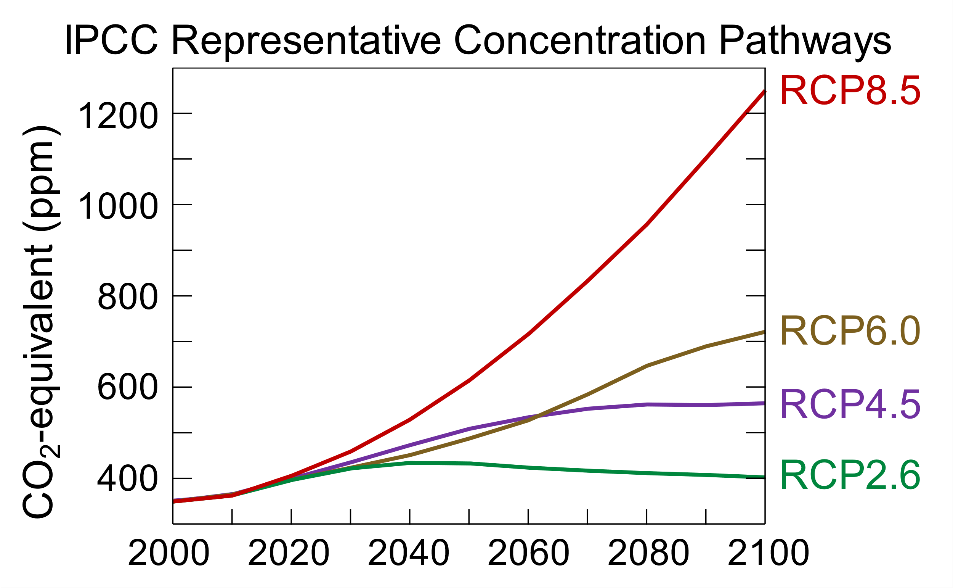
China has pledged that its emissions will peak around 2030, but that high-water mark would still mean that the country is generating huge quantities CO2 — 12.9 billion to 14.7 billion tons of carbon dioxide annually for the next decade, or as much as 15 percent per year above 2015 levels, according to a Climate Action Tracker analysis.
Amazon rainforest now appears to be contributing to climate change
National Geographic 12 Mar 2021
The Amazon rainforest is most likely now a net contributor to warming of the planet, according to a first-of-its-kind analysis from more than 30 scientists.
For years, researchers have expressed concern that rising temperatures, drought, and deforestation are reducing the capacity of the world’s largest rainforest to absorb carbon dioxide from the atmosphere, helping to draw down the amount that lives there as a result of human activities. Recent studies have even suggested that some portions of the tropical landscape already may release more carbon than they store.
The research, supported by the National Geographic Society and published today in Frontiers in Forests and Global Change, estimates that atmospheric warming from all of these sources combined now appears to swamp the forest’s natural cooling effect. “Cutting the forest is interfering with its carbon uptake; that’s a problem,” says lead author Kristofer Covey, a professor of environmental studies at New York’s Skidmore College. “But when you start to look at these other factors alongside CO2, it gets really hard to see how the net effect isn’t that the Amazon as a whole is really warming global climate.”
At least 1m people facing starvation as Madagascar’s drought worsens
The Guardian, 10th May 2021
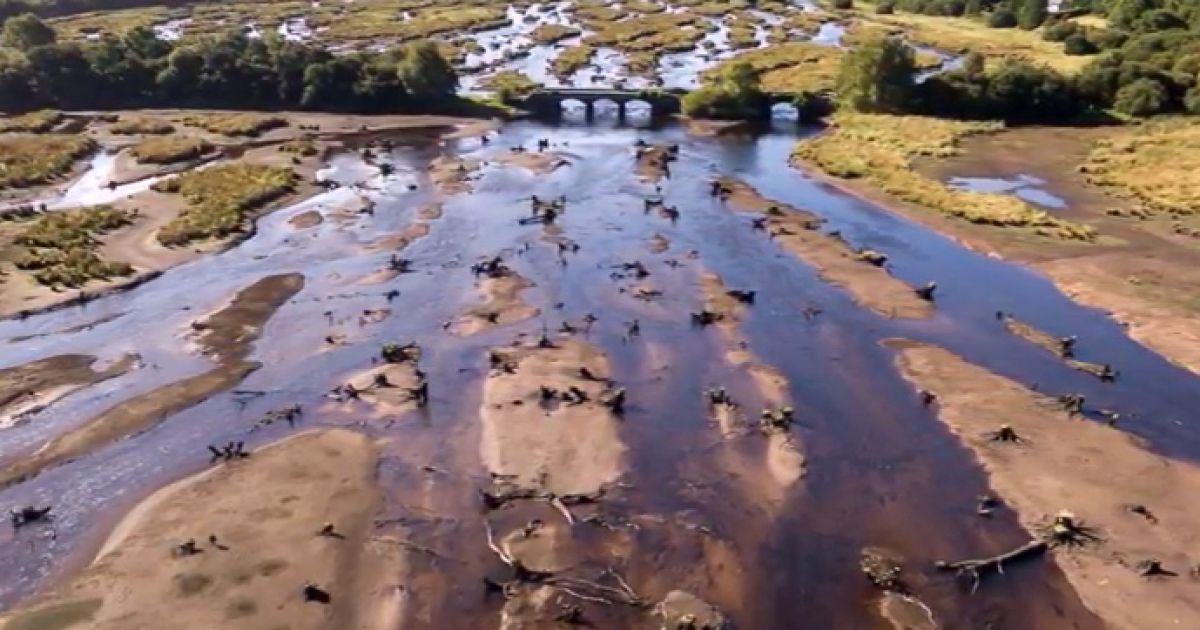
Madagascar’s worst drought in 40 years has left more than a million people facing a year of desperate food shortages. The south of the island will produce less than half its usual harvest in the coming months because of low rains, prolonging a hunger crisis already affecting half the Grand Sud area’s population, the UN estimates. The south saw 50% of its usual rains during the October planting season, in a fourth year of drought.
Julie Reversé, emergency coordinator in Madagascar for Médecins Sans Frontières, said: “Without rain, they will not be able to return to the fields and feed their families. And some do not hesitate to say that it is death that awaits them if the situation does not change, and the rain does not fall.” According to the Famine Early Warning System Network, most poor families have to rely on foraging for wild foods and leaves that are difficult to eat and can be dangerous for children and pregnant women. Aid agencies have reported people eating termites and mixing clay with tamarind.
Greece is experiencing an “unprecedented” ecological crisis due to fires
August 5th 2021 The News24
The Prime Minister of Greece, Kyriakos Mitsotakis, affirmed this Thursday that the country is facing “an unprecedented ecological crisis” due to the strong fires, after a week under an unusual heat wave and after registering more than 80 forest fires in the last 24 hours. «The country faces a unprecedented ecological crisis, with numerous fires of great proportions in different regions, “said the Greek prime minister after visiting the historic center to the city of Olympia, which on Wednesday had to be evacuated due to the unbridled advance of the flames. The fire has rekindled on the outskirts of Athens, after a slight truce in recent hours, and have forced the evacuation of more towns throughout southern Greece, after the heat wave and strong winds have made the situation even worse despite the efforts of firefighters and emergency crews.
Fires in the Mediterranean arc: WWF has warned of the increase in fires in the Mediterranean arc, given the large fires that ravage Turkey and Greece, and remember that what is happening in these countries could happen in Spain since, as the NGO warns, the Spanish forests and the territory as a whole are “ready to burn.”
Fires and floods: can science link extreme weather to climate change?
August 5th 2021 FT
When floods swept through parts of China’s Henan province last month, killing at least 302 people, a group of scientists who specialise in analysing the drivers of extreme weather events found themselves unable to help. Their work involves two core questions: did climate change make this disaster more likely? And did it make it worse? But by the time the storms hit China, the scientists were already fully engaged trying to untangle why the floods in Germany and Belgium earlier in July had been so devastating.
Two weeks before the German floods, the same questions were being asked about a freak heatwave in North America. This week, fires sparked by record temperatures are blazing across Turkey, Greece and Italy. . . . establishing a direct causal link between an individual case of flood, fire or storm and the broader climate is an evolving science — and something that is still desperately hard to do in practice. A litany of factors can influence a natural disaster, including local weather conditions — which may be changing — the shape of the landscape, human choices and natural variability. Even without climate change, extremes such as heatwaves would occur.
Scientists are making some headway. In July, the WWA (World Weather Attribution) made the striking pronouncement that the North American heatwave that sent temperatures in the Canadian village of Lytton soaring to 49.6C would have been “virtually impossible without human-caused climate change”. The group reached a similar verdict about a heatwave last year in Siberia, concluding that the 38C recorded in Verkhoyansk would have been “almost impossible without climate change”.
Blogger’s Note: I have made the point many times that it will be almost impossible to link individual events to global climate. Hard evidence is almost impossible to acquire until large numbers of events and lots of data are available. By then it will be obvious to all. But given this conundrum we must expect a deluge of climate denial. In the last 18 months we have seen a huge amount of fake news and conspiracy theories surrounding Covid19. Given the extremely difficult and urgent decisions that will now need to be made around climate, we can expect a battle royal.
PS I am reading Michael Mann’s new book – The New Climate War on exactly this topic. I will comment on this in detail over the coming days.